Welcome to Stock Trading Signals

Daily Top Stocks Pick Alert

Hottest Stocks in 2015- ANAC- ZIOP -ADXS- EXEL
Hottest Penny Stocks in 2015 - CTRV -HLTH-FRO
Stocks Pick in 2015 - AAPL - BAC - ANR - X
Hottest Stocks in 2014- AVNR- AGIO -ACH- VDSI
Hottest Penny Stocks in 2014 - JOB -PLUG-QTM
My Daily Trading Activities - Membership Link
Showing posts with label Candlestick Education. Show all posts

Sunday, December 15, 2013

The Top 10 Best Candlestick Patterns - 12/15/13

There are many candlestick patterns but only a few are actually worth knowing. Here are 10 candlestick patterns worth looking for. Remember that these patterns are only useful when you understand what is happening in each pattern.
They must be combined with other forms of technical analysis to really be useful. For example, when you see one of these patterns on the daily chart, move down to the hourly chart. Does the hourly chart agree with your expectations on the daily chart? If so, then the odds of a reversal increase.
The following patterns are divided into two parts: Bullish patterns and bearish patterns. These are reversal patterns that show up after a pullback (bullish patterns) or a rally (bearish patterns).

Bullish candlestick patterns

bullish candlestick patterns
Ok, let's begin with the first one...

Engulfing

This is my all time favorite candlestick pattern. This pattern consists of two candles. The first day is a narrow range candle that closes down for the day. The sellers are still in control of the stock but because it is a narrow range candle and volatility is low, the sellers are not very aggressive. The second day is a wide range candle that "engulfs" the body of the first candle and closes near the top of the range. The buyers have overwhelmed the sellers (demand is greater than supply). Buyers are ready to take control of this stock!

Hammer

As discussed on the previous page, the stock opened, then at some point the sellers took control of the stock and pushed it lower. By the end of the day, the buyers won and had enough strength to close the stock at the top of the range. Hammers can develop after a cluster of stop loss orders are hit. That's when professional traders come in to grab shares at a lower price.

Harami

When you see this pattern the first thing that comes to mind is that the momentum preceding it has stopped. On the first day you see a wide range candle that closes near the bottom of the range. The sellers are still in control of this stock. Then on the second day, there is only a narrow range candle that closes up for the day. Note: Do not confuse this pattern with the engulfing pattern. The candles are opposite!

Piercing

This is also a two-candle reversal pattern where on the first day you see a wide range candle that closes near the bottom of the range. The sellers are in control. On the second day you see a wide range candle that has to close at least halfway into the prior candle. Those that shorted the stock on first day are now sitting at a loss on the rally that happens on the second day. This can set up a powerful reversal.

Doji

The doji is probably the most popular candlestick pattern. The stock opens up and goes nowhere throughout the day and closes right at or near the opening price. Quite simply, it represents indecision and causes traders to question the current trend. This can often trigger reversals in the opposite direction. Learn more about how to trade a doji candlestick pattern.

Bearish candlestick patterns

bearish candlestick patterns
You'll notice that all of these bearish patterns are the opposite of the bullish patterns. These patterns come after a rally and signify a possible reversal just like the bullish patterns.
Ok, now it's your turn! I'll let you figure out what is happening in each of the patterns above to cause these to be considered bearish. Look at each candle and try to get into the minds of the traders involved in the candle.

Kickers

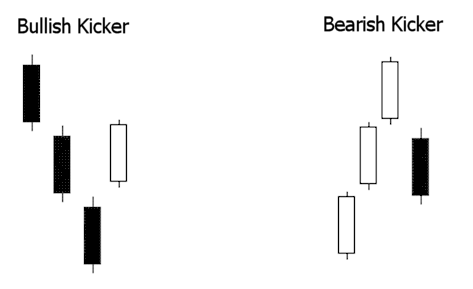
There is one more pattern worthy of mention. A "kicker" is sometimes referred to as the most powerful candlestick pattern of all.
kicker candlestick patterns
You can see in the above graphic why this pattern is so explosive. Like most candle patterns there is a bullish and bearish version. In the bullish version, the stock is moving down and the last red candle closes at the bottom of the range.
Then, on the next day, the stock gaps open above the previous days high and close. This "shock event" forces short sellers to cover and brings in new traders on the long side.
This is reversed in the bearish version.


For the latest updates on the stock market, visit, 
http://daytradingstock-blog.blogspot.com
 

Time Tested Classic Trading Rules for the Modern Trader to Live By

This is a list of classic trading rules that was given to me while on the trading floor in 1984. A senior trader collected these rules from classic trading literature throughout the twentieth century. They obviously withstand the age-old test of time.

I'm sure most everybody knows these truisms in their hearts, but this list is nicely edited and makes a good read.


    Plan your trades. Trade your plan.

    Keep records of your trading results.

    Keep a positive attitude, no matter how much you lose.

    Don't take the market home.

    Continually set higher trading goals.

    Successful traders buy into bad news and sell into good news.

    Successful traders are not afraid to buy high and sell low.

    Successful traders have a well-scheduled planned time for studying the markets.

    Successful traders isolate themselves from the opinions of others.

    Continually strive for patience, perseverance, determination, and rational action.

    Limit your losses - use stops!

    Never cancel a stop loss order after you have placed it!

    Place the stop at the time you make your trade.

    Never get into the market because you are anxious because of waiting.

    Avoid getting in or out of the market too often.

    Losses make the trader studious - not profits. Take advantage of every loss to improve your knowledge of market action.

    The most difficult task in speculation is not prediction but self-control. Successful trading is difficult and frustrating. You are the most important element in the equation for success.

    Always discipline yourself by following a pre-determined set of rules.

    Remember that a bear market will give back in one month what a bull market has taken three months to build.

    Don't ever allow a big winning trade to turn into a loser. Stop yourself out if the market moves against you 20% from your peak profit point.

    You must have a program, you must know your program, and you must follow your program.

    Expect and accept losses gracefully. Those who brood over losses always miss the next opportunity, which more than likely will be profitable.

    Split your profits right down the middle and never risk more than 50% of them again in the market.

    The key to successful trading is knowing yourself and your stress point.

    The difference between winners and losers isn't so much native ability as it is discipline exercised in avoiding mistakes.

    In trading as in fencing there are the quick and the dead.

    Speech may be silver but silence is golden. Traders with the golden touch do not talk about their success.

    Dream big dreams and think tall. Very few people set goals too high. A man becomes what he thinks about all day long.

    Accept failure as a step towards victory.

    Have you taken a loss? Forget it quickly. Have you taken a profit? Forget it even quicker! Don't let ego and greed inhibit clear thinking and hard work.

    One cannot do anything about yesterday. When one door closes, another door opens. The greater opportunity always lies through the open door.

    The deepest secret for the trader is to subordinate his will to the will of the market. The market is truth as it reflects all forces that bear upon it. As long as he recognizes this he is safe. When he ignores this, he is lost and doomed.

    It's much easier to put on a trade than to take it off.

    If a market doesn't do what you think it should do, get out.

    Beware of large positions that can control your emotions. Don't be overly aggressive with the market. Treat it gently by allowing your equity to grow steadily rather than in bursts.

    Never add to a losing position.

    Beware of trying to pick tops or bottoms.

    You must believe in yourself and your judgement if you expect to make a living at this game.

    In a narrow market there is no sense in trying to anticipate what the next big movement is going to be - up or down.

    A loss never bothers me after I take it. I forget it overnight. But being wrong and not taking the loss - that is what does the damage to the pocket book and to the soul.

    Never volunteer advice and never brag of your winnings.

    Of all speculative blunders, there are few greater than selling what shows a profit and keeping what shows a loss.

    Standing aside is a position.

    It is better to be more interested in the market's reaction to new information than in the piece of news itself.

    If you don't know who you are, the markets are an expensive place to find out.

    In the world of money, which is a world shaped by human behavior, nobody has the foggiest notion of what will happen in the future. Mark that word - Nobody! Thus the successful trader does not base moves on what supposedly will happen but reacts instead to what does happen.

    Except in unusual circumstances, get in the habit of taking your profit too soon. Don't torment yourself if a trade continues winning without you. Chances are it won't continue long. If it does, console yourself by thinking of all the times when liquidating early reserved gains that you would have otherwise lost.

    When the ship starts to sink, don't pray - jump!

    Lose your opinion - not your money.

    Assimilate into your very bones a set of trading rules that works for you.

For the latest updates on the stock market, visit, 
http://daytradingstock-blog.blogspot.com
 

Saturday, April 14, 2012

Candlesticks - Vol 6 - Hanging Man

Candlesticks - Vol 6 - Hanging Man

Type: Reversal Pattern

Appearance: Opening price and closing prices are both at or very near the high price of the bar, with a much lower daily intra-candle low.

Typical Duration: 1 bar/candle

Description: The reasoning behind this pattern is that despite the high closing price, it is one of the first signs of buying interest starting to dry up, with sellers managing to make a significant intra-candle low before being overpowered by buyers.
  • Rising trend - the hanging man is only valid after a significant up trend in price.
  • The daily open, high, and close must be equal or nearly equal. By their very definition.
  • The hanging man pattern is confirmed more definitely if price moves down the following bar.
Strengths: It is a very early signal that buyers may be drying up, potentially getting you in the market very early in the process of a trend reversal. Stop losses can be set very tight and take profits can be large, since a larger scale down trend is just being formed. This sets us up with a very attractive reward:risk ratio.

Weaknesses: The selling pressure can easily come from profit taking or from large non-speculative flows, showing many false reversals. Statistically, the hanging man pattern on its own does not provide any discernible edge in the market, and is akin to a coin toss.

How to Trade It:
Most studies done on the hanging man pattern on daily charts suggest that it provides no detectable edge in trading. Therefore, the pattern should only be used as confirmation of other technical or fundamental signals that point to a trend reversal. In the absence of such signals, it is not recommended for traders to base any trades on a hanging man reversal pattern alone. Should such confirming signals exist, the way to trade it is to wait for the next bar to make a high that is slightly above the close of the hanging man, and enter a short position. Stop losses can be fairly tight, and take profit targets can be large in case the trend really is reversing. Studies on how well this pattern works on intraday charts are not available at this time.


I will post in future for Technical chart education YouTube for my viewers.I hope it help for everyone.

For more Candlestick Education  - Go Here

For the latest updates on the stock market, visit, 
http://technicalanalysis-blog.blogspot.com/ 

Saturday, November 12, 2011

Candlesticks - Vol 4 - Candle Pattern Stages

Candlesticks - Vol 6 - Hanging Man

Type: Reversal Pattern

Appearance: Opening price and closing prices are both at or very near the high price of the bar, with a much lower daily intra-candle low.

Typical Duration: 1 bar/candle

Description: The reasoning behind this pattern is that despite the high closing price, it is one of the first signs of buying interest starting to dry up, with sellers managing to make a significant intra-candle low before being overpowered by buyers.
  • Rising trend - the hanging man is only valid after a significant up trend in price.
  • The daily open, high, and close must be equal or nearly equal. By their very definition.
  • The hanging man pattern is confirmed more definitely if price moves down the following bar.
Strengths: It is a very early signal that buyers may be drying up, potentially getting you in the market very early in the process of a trend reversal. Stop losses can be set very tight and take profits can be large, since a larger scale down trend is just being formed. This sets us up with a very attractive reward:risk ratio.

Weaknesses: The selling pressure can easily come from profit taking or from large non-speculative flows, showing many false reversals. Statistically, the hanging man pattern on its own does not provide any discernible edge in the market, and is akin to a coin toss.

How to Trade It:
Most studies done on the hanging man pattern on daily charts suggest that it provides no detectable edge in trading. Therefore, the pattern should only be used as confirmation of other technical or fundamental signals that point to a trend reversal. In the absence of such signals, it is not recommended for traders to base any trades on a hanging man reversal pattern alone. Should such confirming signals exist, the way to trade it is to wait for the next bar to make a high that is slightly above the close of the hanging man, and enter a short position. Stop losses can be fairly tight, and take profit targets can be large in case the trend really is reversing. Studies on how well this pattern works on intraday charts are not available at this time.


I will post in future for Technical chart education YouTube for my viewers.I hope it help for everyone.

For more Candlestick Education  - Go Here

For the latest updates on the stock market, visit, 
http://technicalanalysis-blog.blogspot.com/ 

Saturday, October 22, 2011

Candlesticks - Vol 5 - Candle Pattern Stages

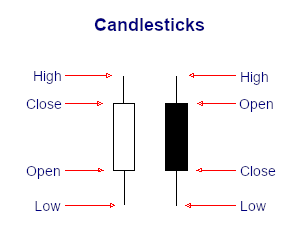
Candlesticks contain the same data as a normal bar chart but highlight the relationship between opening and closing prices. The narrow stick represents the range of prices traded during the period (high to low) while the broad mid-section represents the opening and closing prices for the period.
  • If the close is higher than the open - the candlestick mid-section is hollow or shaded blue/green.
  • If the open is higher than the close - the candlestick mid-section is filled in or shaded red.
candlestick components
The advantage of candlestick charts is the ability to highlight trend weakness and reversal signals that may not be apparent on a normal bar chart.
 Candlestick Charting - Vol 4 - Candle Pattern Stages  
 
I will post in future for Technical chart education YouTube for my viewers.I hope it help for everyone.

For more Candlestick Education  - Go Here

For the latest updates on the stock market, visit, 
http://technicalanalysis-blog.blogspot.com/ 

Sunday, October 16, 2011

Candlesticks - Vol 4 - Candle Pattern Stages

Candlestick Charting - Vol 4 - Candle Pattern Stages  
 
I will post in future for Technical chart education YouTube for my viewers.I hope it help for everyone.

For more Candlestick Education  - Go Here

For the latest updates on the stock market, visit, 
http://technicalanalysis-blog.blogspot.com/ 

Saturday, October 8, 2011

Candlestick Charting - Video 3 - Candle Addition and Development

Candlestick Charting - Video 3 - Candle Addition and Development 

I will post in future for Technical chart education YouTube for my viewers.I hope it help for everyone.

For more Candlestick Education  - Go Here

For the latest updates on the stock market, visit, 
http://technicalanalysis-blog.blogspot.com/ 

Saturday, October 1, 2011

Candlesticks Vol 2 - Candlestick Sentiment

Candlesticks are usually composed of the body (black or white), and an upper and a lower shadow (wick): the area between the open and the close is called the real body, price excursions above and below the real body are called shadows. The wick illustrates the highest and lowest traded prices of a security during the time interval represented. The body illustrates the opening and closing trades. If the security closed higher than it opened, the body is white or unfilled, with the opening price at the bottom of the body and the closing price at the top. If the security closed lower than it opened, the body is black, with the opening price at the top and the closing price at the bottom. A candlestick need not have either a body or a wick.

To better highlight price movements, modern candlestick charts (especially those displayed digitally) often replace the black or white of the candlestick body with colors such as red (for a lower closing) and blue or green (for a higher closing).

Candlesticks Vol 1 - Candlestick Design


I will post in future for Technical chart education YouTube for my viewers.I hope it help for everyone.

For more Candlestick Education  - Go Here

For the latest updates on the stock market, visit, 
http://technicalanalysis-blog.blogspot.com/ 

Sunday, September 25, 2011

What is RSI – Relative Strength Index & Candlesticks Vol 1 – Candlestick Design

What is RSI - Relative Strength Index
Developed by J. Welles Wilder and introduced in his 1978 book, New Concepts in Technical Trading Systems, the Relative Strength Index (RSI) is an extremely useful and popular momentum oscillator. The RSI compares the magnitude of a stock's recent gains to the magnitude of its recent losses and turns that information into a number that ranges from 0 to 100. It takes a single parameter, the number of time periods to use in the calculation. In his book, Wilder recommends using 14 periods.

http://stockcharts.com/school/doku.php?id=chart_school:technical_indicators:relative_strength_in
Overbought/Oversold
Wilder recommended using 70 and 30 and overbought and oversold levels respectively. Generally, if the RSI rises above 30 it is considered bullish for the underlying stock. Conversely, if the RSI falls below 70, it is a bearish signal. Some traders identify the long-term trend and then use extreme readings for entry points. If the long-term trend is bullish, then oversold readings could mark potential entry points.

Divergences
Buy and sell signals can also be generated by looking for positive and negative divergences between the RSI and the underlying stock. For example, consider a falling stock whose RSI rises from a low point of (for example) 15 back up to say, 55. Because of how the RSI is constructed, the underlying stock will often reverse its direction soon after such a divergence. As in that example, divergences that occur after an overbought or oversold reading usually provide more reliable signals.

Centerline Crossover
The centerline for RSI is 50. Readings above and below can give the indicator a bullish or bearish tilt. On the whole, a reading above 50 indicates that average gains are higher than average losses and a reading below 50 indicates that losses are winning the battle. Some traders look for a move above 50 to confirm bullish signals or a move below 50 to confirm bearish signals. 

Candlesticks Vol 1 - Candlestick Design


I will post in future for Technical chart education YouTube for my viewers.I hope it help for everyone.

For more Candlestick Education  - Go Here

For the latest updates on the stock market, visit, 
http://technicalanalysis-blog.blogspot.com/ 

What Does Candlestick Mean?

What Does Candlestick Mean?
A price chart that displays the high, low, open, and close for a security each day over a specified period of time.

I will post in future for Technical chart education YouTube for my viewers.I hope it help for everyone.

For more Candlestick Education  - Go Here

For the latest updates on the stock market, visit, 
http://technicalanalysis-blog.blogspot.com/ 

Saturday, September 24, 2011

What is BLACK & RED "OXY" (OXYMORONIC) Candlesticks ?

BLACK & RED "OXY" (OXYMORONIC) CANDLESTICKS

General (Traditional) Rules for Filled vs Hollow Candlesticks:

 1. If Close Today < Open Today, Candlestick = Filled
 
 2. If Close Today > Open Today, Candlestick = Hollow

Note: On StockCharts.com, filled candlesticks are
normally colored RED.

RULES FOR OXY (OXYMORONIC) CANDLESTICKS

 1. If Close Today < Open Today,
    and
    Close Today > Close Yesterday,
    Candlestick = Filled & Black

This is a BLACK OXY.

 2. If Close Today > Open Today,
    and
    Close Today < Close yesterday,
    Candlestick = Hollow & Red

This is a RED OXY.

These candlesticks are called OXY, i.e., "oxymoronic,"
(meaning self-contradictory), because they are colored
bullishly, but filled bearishly (i.e., a filled, black
candle) or vice versa (i.e., a hollow red candle).

For example, in the GE chart above, notice that filled, black candlesticks appear at several important peaks on the chart. They happened because GE opened significantly higher than the previous day's close ("gapped up"), fell during the day, yet managed to still close above the previous day's close. Less obviously, on May 23rd, a hollow red candle appears because GE gapped down on the open, rose during the day, but didn't close above the closing price for May 22nd.

WHO CARES AND WHY?

OXY candlesticks are good to look out for because they often signal a short term reversal. But, as with all candlestick signals, they should be judged in the overall context of the individual chart and the conditions of the market, etc.

This information restated from: http://stockcharts.com/commentary/mailbag/mailbag20000809.html


For the latest updates on the stock market, visit, 
http://daytradingstock-blog.blogspot.com/