Welcome to Stock Trading Signals

Daily Top Stocks Pick Alert

Hottest Stocks in 2015- ANAC- ZIOP -ADXS- EXEL
Hottest Penny Stocks in 2015 - CTRV -HLTH-FRO
Stocks Pick in 2015 - AAPL - BAC - ANR - X
Hottest Stocks in 2014- AVNR- AGIO -ACH- VDSI
Hottest Penny Stocks in 2014 - JOB -PLUG-QTM
My Daily Trading Activities - Membership Link

Sunday, December 15, 2013

China flash PMI hits three-month low - 12/15/13


China flash PMI hits three-month low
  • China HSBC December flash PMI: 50.5 versus 50.8 (final) in November.
  • Today's reading is the lowest print in three months.
  • Full release

  • ETFs: FXI, PGJ, GXC, FXP, HAO, CYB, YINN, CNY, TAO, CHIQ, CHIX, MCHI, YANG, PEK, CQQQ, XPP, ASHR, QQQC, DSUM, YAO, CHXX, CHII, FXCH, CHXF, ECNS, CHIE, KWEB, YXI, CHIM, KFYP, FCA, TCHI, CHLC, CHNA
For the latest updates on the stock market, visit, 
http://daytradingstock-blog.blogspot.com/

Top Performing Stocks for the Week December 9-16, 2013

During regular trading hours, there were many stocks that continued to break up to the upside or down side. These stocks are usually going up or down with news.If you are looking to day trade today, you might want to check out the following stocks. I usually throw these on my watch list and monitor with resistance &  support levels. Below are a list of stocks that I am watching for December 16, Also check out my Top 2012 Stock Gainers, Top Pick for 2013.Hot stocks Today Right Here.My Daily Trading Activities - Membership Access

These are the Best Performing Stocks of the Week December 6-13, 2013.

Ticker    Company    Performance (Week)
CYTR  CytRx Corporation       127.89%
YRCW            YRC Worldwide Inc.   47.81%
TWTR Twitter, Inc.      31.26%
WBAI  500.com Limited          30.37%
RLYP  Relypsa, Inc.    28.13%
GIVN  Given Imaging Ltd.       26.38%
UNS    UniSource Energy Corporation 25.11%
VISN   VisionChina Media Inc.            23.57%
AMBI  Ambit Biosciences Corporation 20.45%
GOMO            Sungy Mobile Limited   20.32%
EJ        E-House (China) Holdings Limited        20.03%
CCIH   ChinaCache International Holdings Ltd. 18.72%
NRF    NorthStar Realty Finance Corp.            18.60%
TXI      Texas Industries Inc.     16.31%
AER     AerCap Holdings N.V. 16.01%
SB       Safe Bulkers, Inc.         15.82%
MILL   Miller Energy Resources, Inc.   14.68%
QIWI   Qiwi plc           14.15%
SBLK  Star Bulk Carriers Corp.           13.59%
SEM    Select Medical Holdings Corporation    13.01%
OMER Omeros Corporation    12.86%
GRPN  Groupon, Inc.   12.65%
ZLC     Zale Corporation          12.42%
CALL  magicJack VocalTec Ltd.         11.32%
MDXG            MiMedx Group, Inc.    11.32%
FB       Facebook, Inc. 11.22%
RMBS Rambus Inc.     11.19%
NM      Navios Maritime Holdings Inc.  10.95%
KND   Kindred Healthcare Inc.            10.35%
ICLD   InterCloud Systems, Inc.           10.27%
UBNT  Ubiquiti Networks, Inc.            10.15%
VLCCF           Knightsbridge Tankers Limited  9.52%
ADBE  Adobe Systems Inc.     9.51%
SRPT   Sarepta Therapeutics, Inc.        9.19%
HDS    HD Supply Holdings, Inc.         9.12%

For the latest updates on the stock market, visit, 

Netflix, Inc. (NFLX) & First Solar, Inc.(FSLR) - Weekly Stocks Pick Performance December 9-13, 2013

During last week of trading, there were many stocks that continued to break out to the upside or downside. Below of stocks I picked for trade in December 9-13, 2013.You can also check previous stocks to buy reports - Right here & Previous Weekly Stocks Pick Gainers- Right here

First Solar, Inc.(FSLR)                                         +1.70 long side
First Solar, Inc.(FSLR)
                                         -1.00 Short side
Netflix, Inc. (NFLX)                                             +4.70 long side

                                                                                    12/15/13

Weekly Stocks Pick Rule: When ever I buy or short stocks if that stocks go up short term quick 5-10% gain, I took profit and buy back in low price again. When ever I buy stock always have stop price. Always protect my original capital.

For the latest updates on the stock market, visit, 
http://daytradingstock-blog.blogspot.com

The Top 10 Best Candlestick Patterns - 12/15/13

There are many candlestick patterns but only a few are actually worth knowing. Here are 10 candlestick patterns worth looking for. Remember that these patterns are only useful when you understand what is happening in each pattern.
They must be combined with other forms of technical analysis to really be useful. For example, when you see one of these patterns on the daily chart, move down to the hourly chart. Does the hourly chart agree with your expectations on the daily chart? If so, then the odds of a reversal increase.
The following patterns are divided into two parts: Bullish patterns and bearish patterns. These are reversal patterns that show up after a pullback (bullish patterns) or a rally (bearish patterns).

Bullish candlestick patterns

bullish candlestick patterns
Ok, let's begin with the first one...

Engulfing

This is my all time favorite candlestick pattern. This pattern consists of two candles. The first day is a narrow range candle that closes down for the day. The sellers are still in control of the stock but because it is a narrow range candle and volatility is low, the sellers are not very aggressive. The second day is a wide range candle that "engulfs" the body of the first candle and closes near the top of the range. The buyers have overwhelmed the sellers (demand is greater than supply). Buyers are ready to take control of this stock!

Hammer

As discussed on the previous page, the stock opened, then at some point the sellers took control of the stock and pushed it lower. By the end of the day, the buyers won and had enough strength to close the stock at the top of the range. Hammers can develop after a cluster of stop loss orders are hit. That's when professional traders come in to grab shares at a lower price.

Harami

When you see this pattern the first thing that comes to mind is that the momentum preceding it has stopped. On the first day you see a wide range candle that closes near the bottom of the range. The sellers are still in control of this stock. Then on the second day, there is only a narrow range candle that closes up for the day. Note: Do not confuse this pattern with the engulfing pattern. The candles are opposite!

Piercing

This is also a two-candle reversal pattern where on the first day you see a wide range candle that closes near the bottom of the range. The sellers are in control. On the second day you see a wide range candle that has to close at least halfway into the prior candle. Those that shorted the stock on first day are now sitting at a loss on the rally that happens on the second day. This can set up a powerful reversal.

Doji

The doji is probably the most popular candlestick pattern. The stock opens up and goes nowhere throughout the day and closes right at or near the opening price. Quite simply, it represents indecision and causes traders to question the current trend. This can often trigger reversals in the opposite direction. Learn more about how to trade a doji candlestick pattern.

Bearish candlestick patterns

bearish candlestick patterns
You'll notice that all of these bearish patterns are the opposite of the bullish patterns. These patterns come after a rally and signify a possible reversal just like the bullish patterns.
Ok, now it's your turn! I'll let you figure out what is happening in each of the patterns above to cause these to be considered bearish. Look at each candle and try to get into the minds of the traders involved in the candle.

Kickers

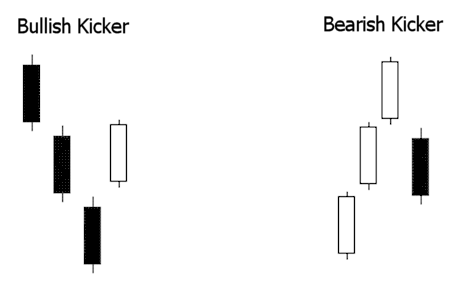
There is one more pattern worthy of mention. A "kicker" is sometimes referred to as the most powerful candlestick pattern of all.
kicker candlestick patterns
You can see in the above graphic why this pattern is so explosive. Like most candle patterns there is a bullish and bearish version. In the bullish version, the stock is moving down and the last red candle closes at the bottom of the range.
Then, on the next day, the stock gaps open above the previous days high and close. This "shock event" forces short sellers to cover and brings in new traders on the long side.
This is reversed in the bearish version.


For the latest updates on the stock market, visit, 
http://daytradingstock-blog.blogspot.com