Welcome to Stock Trading Signals

Daily Top Stocks Pick Alert

Hottest Stocks in 2015- ANAC- ZIOP -ADXS- EXEL
Hottest Penny Stocks in 2015 - CTRV -HLTH-FRO
Stocks Pick in 2015 - AAPL - BAC - ANR - X
Hottest Stocks in 2014- AVNR- AGIO -ACH- VDSI
Hottest Penny Stocks in 2014 - JOB -PLUG-QTM
My Daily Trading Activities - Membership Link

Saturday, October 22, 2011

Candlesticks - Vol 5 - Candle Pattern Stages

Candlesticks contain the same data as a normal bar chart but highlight the relationship between opening and closing prices. The narrow stick represents the range of prices traded during the period (high to low) while the broad mid-section represents the opening and closing prices for the period.
  • If the close is higher than the open - the candlestick mid-section is hollow or shaded blue/green.
  • If the open is higher than the close - the candlestick mid-section is filled in or shaded red.
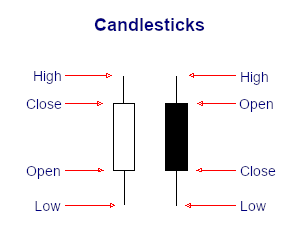
candlestick components
The advantage of candlestick charts is the ability to highlight trend weakness and reversal signals that may not be apparent on a normal bar chart.
 Candlestick Charting - Vol 4 - Candle Pattern Stages  
 
I will post in future for Technical chart education YouTube for my viewers.I hope it help for everyone.

For more Candlestick Education  - Go Here

For the latest updates on the stock market, visit, 
http://technicalanalysis-blog.blogspot.com/